Blog
July 20, 2018
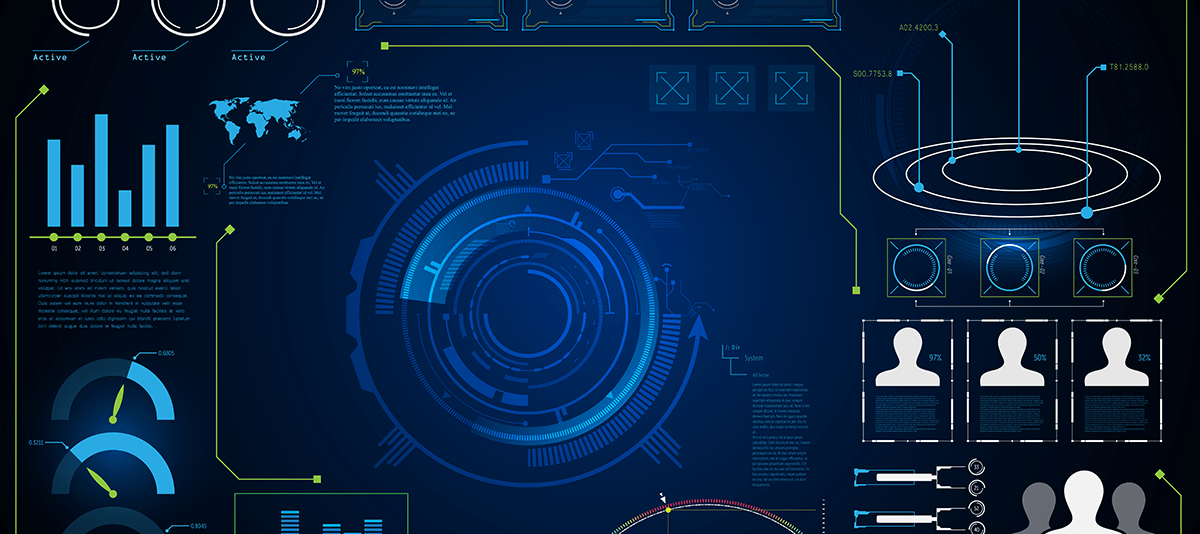
Creating Effective Security Dashboards
Introduction
The advent of Security Information and Event Management (SIEM) tools more than a decade ago centralized and automated the collection and analysis of source data for more efficient identification and response to threats. It also initiated the concept of using log aggregations and automated sorting methods to represent trends and useful system information visually in intuitive user dashboards.
As SIEMs became more popular, identification of key performance indicators and other metrics to understand the security landscape of the organization became a larger demand across the industry. If a picture really is worth a thousand words, then SIEM security dashboards can speak volumes about the state of cyber security within an organization. At least, that’s the goal.
Are your security dashboards worth their visual “weight” in words? Make sure they are by following these fundamental considerations for your design:
What Does Important Information Look Like?
Before you can create effective security dashboards, it is essential to determine what information is useful – which, of course, depends on who’s looking at the data.
Know Your Audience
Most CIOs want a simple picture – a high-level overview of the organization’s overall business risk, including a SOC audit. In most cases, they want to know if the situation is good or bad and the current degree of each. The goal of the executive team is not to understand how to fix the problem, just if one exists or not. A SOC analyst, though, needs a more detailed picture of the patterns and trends across the infrastructure. The analyst needs the verbose details of threats and behaviors so he or she can collaborate evidence and execute a cohesive plan for remediation.
Effective dashboard design begins with a discovery phase that includes talking with your audiences to gain a solid understanding of how they use security information, what metrics they need to see, and how detailed they need those metrics. This knowledge will help you determine and present the information that is most relevant for each set of users. When asked what they want to see, most users don’t know immediately.
Try asking questions like:
• What sort of events and data have you needed to find in the past?
• What are the workflows you routinely use when looking for data?
• Are there specific activities being performed that we need to be aware of?
• Are there any that require immediate response?
Consider the Source
SIEM tools centralize and aggregate data from multiple sources – networks, servers, applications and more – across your enterprise. That represents a lot of data. So much data, in fact, that it can overwhelm users and create excess “noise” that can hide real threat indicators. A visualization’s supporting data should represent the critical activity of the system or network the audience is trying to understand. Information that is not useful should be suppressed.
There’s a balance to be struck between data that seems important and data that is actionable. High-level dashboards tend to focus most on data that seems important but isn’t always actionable. Conversely, detailed analyst dashboard should consist almost exclusively of information that is actionable and has a clear plan of attack coming from it.
For example, “failed login attempts” is a common activity metric. Learning that a particular user types his password incorrectly every time he logs into his desktop likely is not important, however, 10 login attempts from an external source may be relevant. While a high-level dashboard might want to see password failure trends, this information is not always actionable. Filtering the data based on the source (in this case an internal device versus external) and number of login attempts (one versus 10), therefore, removes irrelevant “noise” and becomes actionable, while ensures that your dashboard presents only the most useful information.
Take Action
In our previous example, we detected multiple login attempts to a user account from an external source. The attacker in this case is failing to connect and may not be a serious threat. But why present data that isn’t actionable? In many cases, information can become actionable as it’s filtered down. We discussed failed login attempts being unactionable, but if these attempts can be attributed to a collection of user accounts or IP addresses then it becomes immediately actionable.
Some organizations may block the source IP address for a period of time after a certain number of attempts or require targeted users to use multi-factor authentication for all sessions. If that’s the case, the information becomes immediately actionable, but if the organization has determined that no response will be taken, then the information is not actionable and should not be reflected in most dashboards.
What Your Visualizations Say about the Data
One of the challenges of designing effective security dashboards is presenting the right balance of details in a view that can be understood by the user “at-a-glance.” The main goal for your visualizations is for the actionable information to leap out. A secondary objective is to ensure that real issues aren’t flying under the radar.
Simpler Is Better
Selecting the proper visualization to represent a subset of data is critical to the appropriate analysis of event log information – and to the easy consumption of the information it’s conveying. Simpler is better for these “at-a-glance” visuals, and using common representations ensure that your dashboards are intuitive. Be sure you understand the user’s perspective of “normal” in the log data to represent outliers and security anomalies effectively. Clearly define and label the specific metrics to ensure it’s clear how these values are qualified.
For example, one element on a dashboard might simply display a number of website hits over the last hour. This can be an important metric from an operations perspective because too many hits may indicate an attack or simply a need to quickly deploy additional servers, but being too low may suggest that something has broken within the website and customers are being denied access. When someone who is unfamiliar with the dashboard and normal operations see this, it will not be immediately useful to them since they don’t know what normal and extreme values look like. By configuring this as a gauge or color coding the number based on certain ranges, this value becomes useful to almost anyone who reviews it.
Pie or Bar?
There are many options for visualizations. Again, the “simpler is better” rule applies. Determine what the data represents, choose a visualization type, select a time range for efficient data streaming, then generate the visualization and tailor as necessary. For example, if a metric aggregates to one value, choose a single-value visual representation and add trend history if applicable.
If the data has many categories, a bar graph or pie chart might be the better choice. Some general guidelines for visualizations are:
• Pie charts are best when the total quantity is not important, only the mix or proportions of different classifications.
• Bar graphs are useful when data of different quantities needs to be compared.
• Bar graphs can also be useful for displaying data in more than two axis, as bars can be grouped.
• Stacked bar graphs are useful for comparing proportions across multiple samples, such as comparing percentages across multiple days.
• Gauges are useful for showing the normal limits of a simple, single number metric.
• Tables are useful for providing verbose details or statistics of events
One additional suggestion for making data useful is to be creative with how to use the data and break down the process that humans are using when they review it. For instance, imagine a website that spikes in traffic during the lunch hour by a significant margin. Instead of having a histogram that spreads across a 24 hours period, it might be more beneficial to focus this down. Instead, try a histogram that provides just the last hour and provides an additional line that is data between 24 and 25 hours old for historical comparison purposes.
Can You Expand on That?
Most security dashboard programs allow users to drill into the data visualization for expanded detail, specifically tailored data, or other dashboard views. Linked dashboards can be designed to enable users to select and display events from the previous dashboard. Both drill-downs and linked views enable your dashboard to serve multiple audiences, giving users the ability to expand on the top-level visualizations and delve into a more detailed selection of supporting data in order to analyze suspicious events and patterns.
Conclusion
Creating an effective security dashboard is a dynamic process that evolves as your security goals shift, as new sources and audiences are added, and as user requirements change.
Compatibility with the underlying sources is critical, and your dashboard should be integrated properly with the source data in order to receive data feeds consistently and reliably. New sources should be added regularly so there are no gaps in the security data that your users are reviewing.
It’s important to remember that different users view data differently. By giving users the ability to drill into the data details and customize the data views in ways that fit their specific needs, your dashboard will transition from an early warning system to an invaluable, versatile investigative tool and information resource.
Finally, always assess your visualizations from the users’ perspective. Will the visuals “speak” to them? Is the information you’re delivering relevant to them? Are there parts of dashboards that they never use or don’t know how to utilize? Your users are, after all, the ones relying on how effectively your security dashboard paints the picture of your environment’s security. And that is worth more than a thousand words.
About the Authors
Ben Dimick is an information security manager at Tevora.
Brandon Richardson is an information security associate at Tevora.